Gallery#
Home for domain-specific narrative examples using multiple HoloViz projects. Each project is isolated and fully described. For information on how to use these projects, see how to get started.
Calculate and plot two-dimensional attractors of a variety of types
Visualizing water depth into the Chesapeake and Delaware Bays
Boids models of swarm intelligence using HoloViews
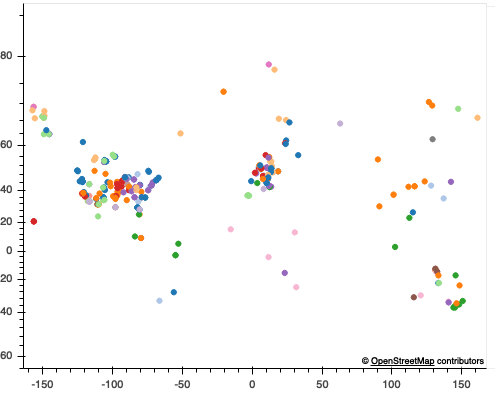
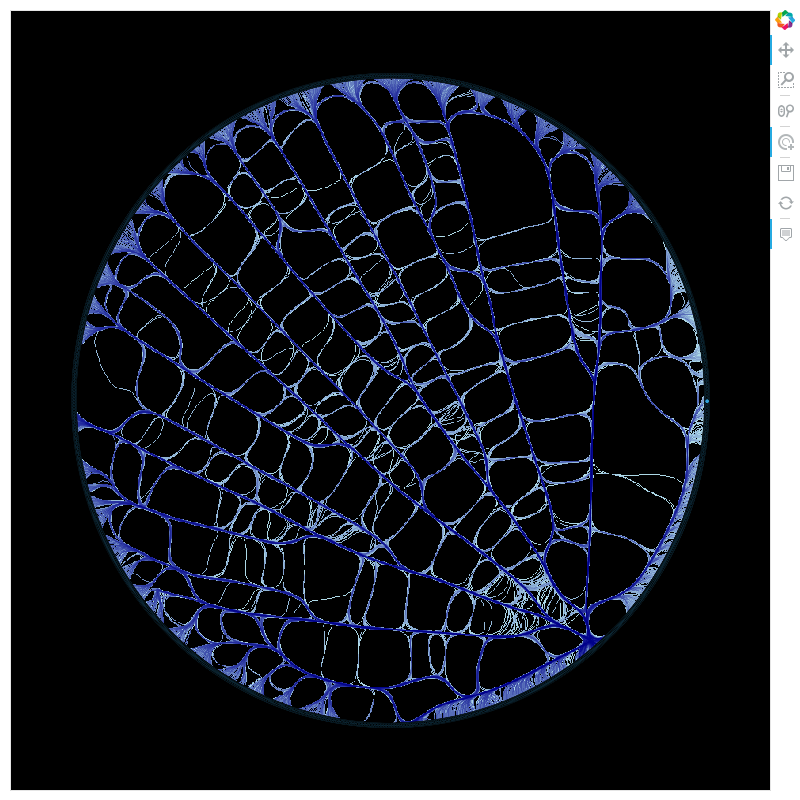
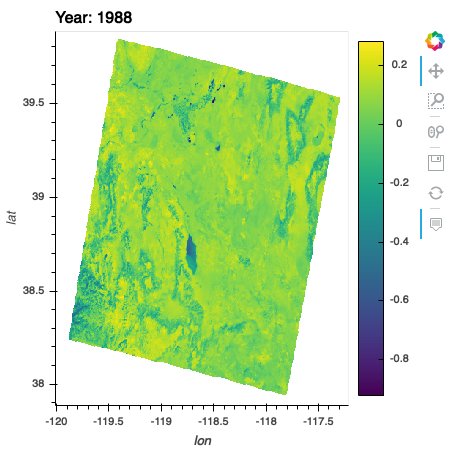
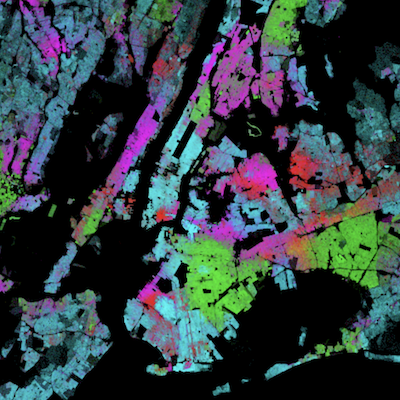
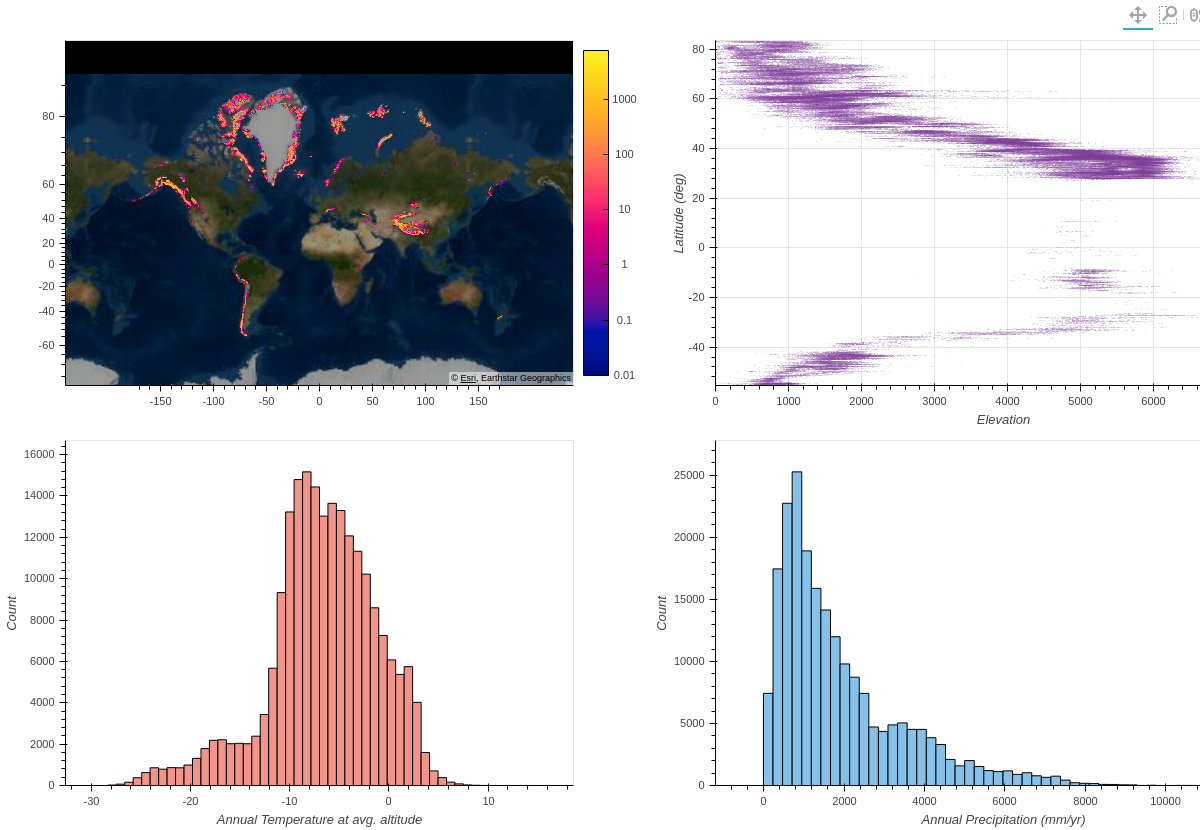
Analysis of NASA Goddard/University of Alabama carbon monitoring project NEE Data Fusion
Visualize 2010 Census demographic data
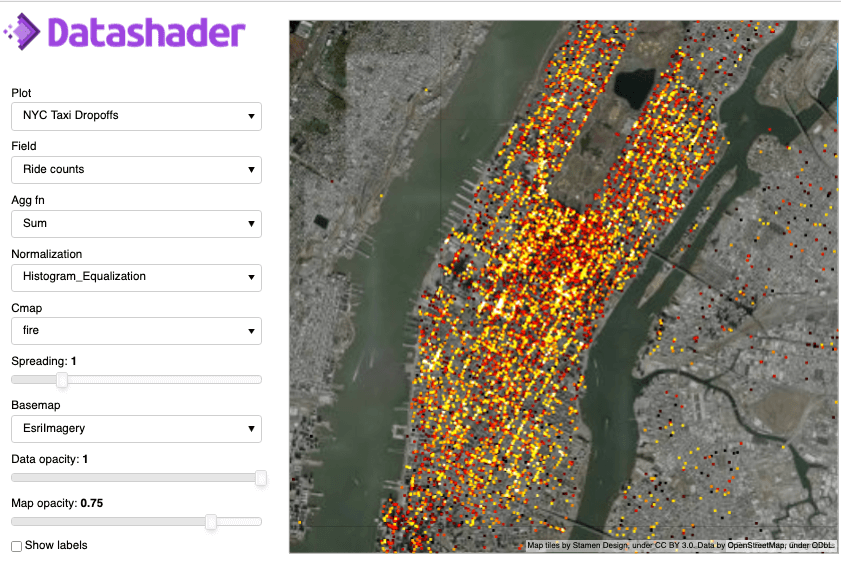
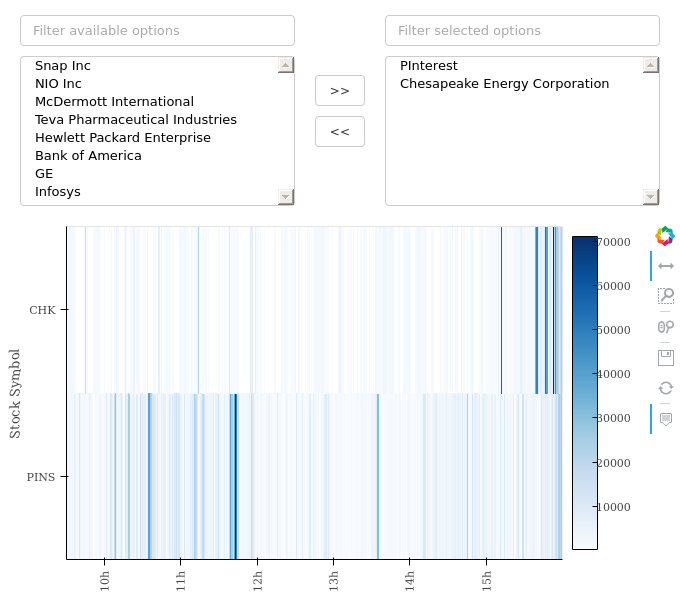
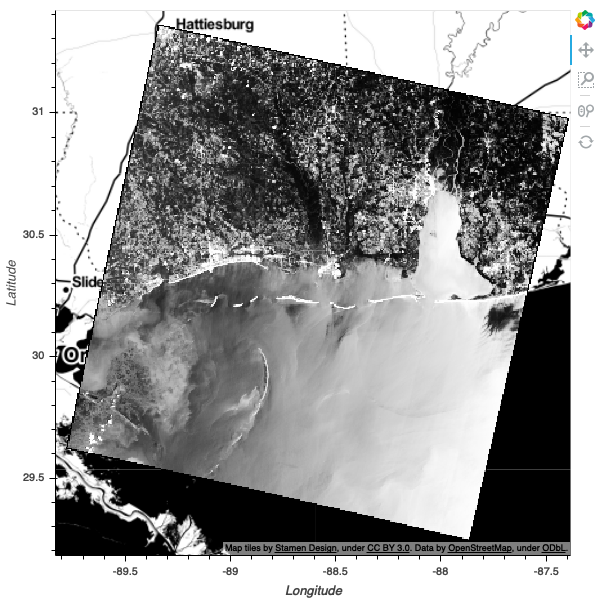
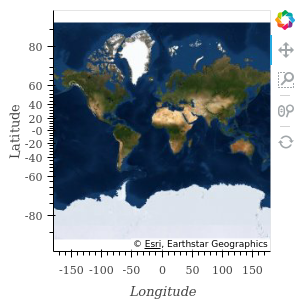
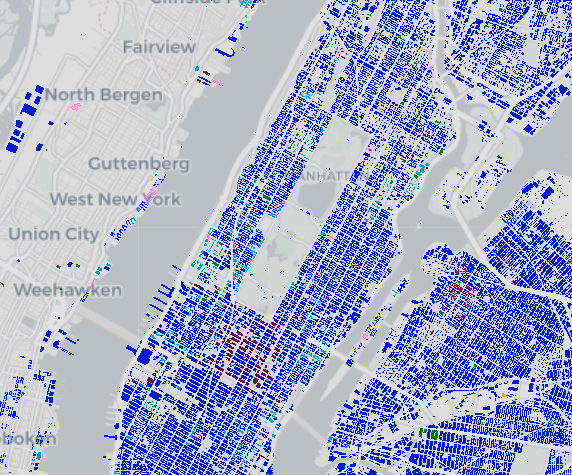
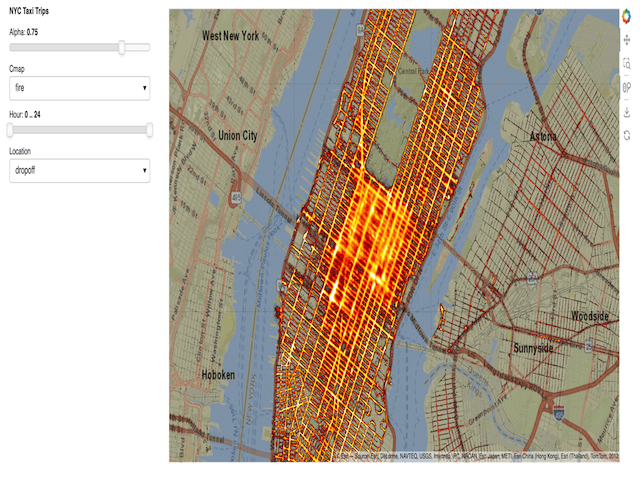
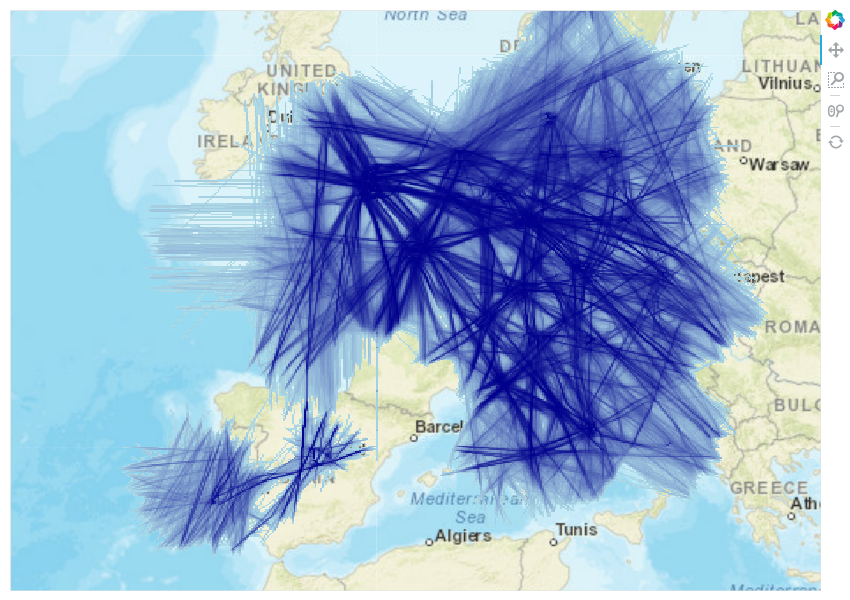
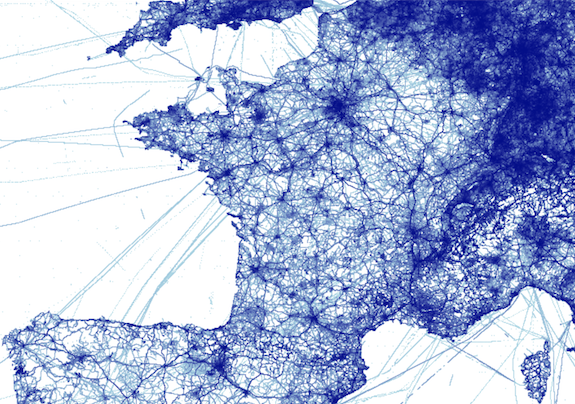
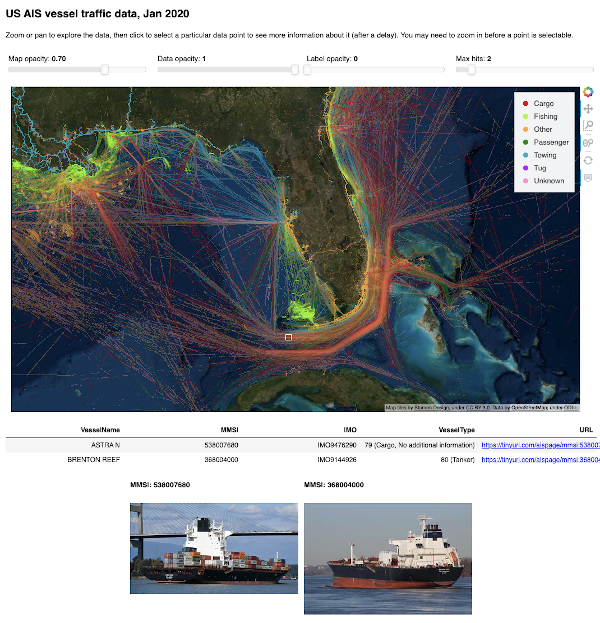
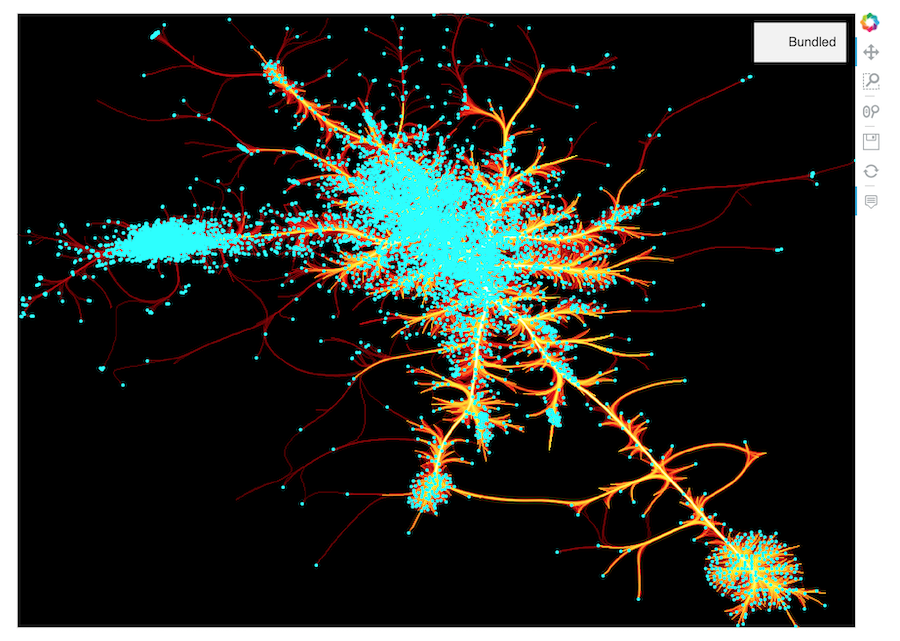
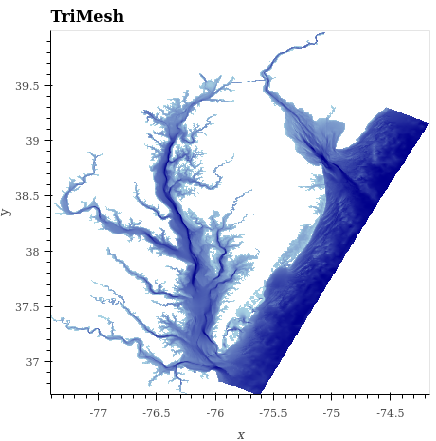
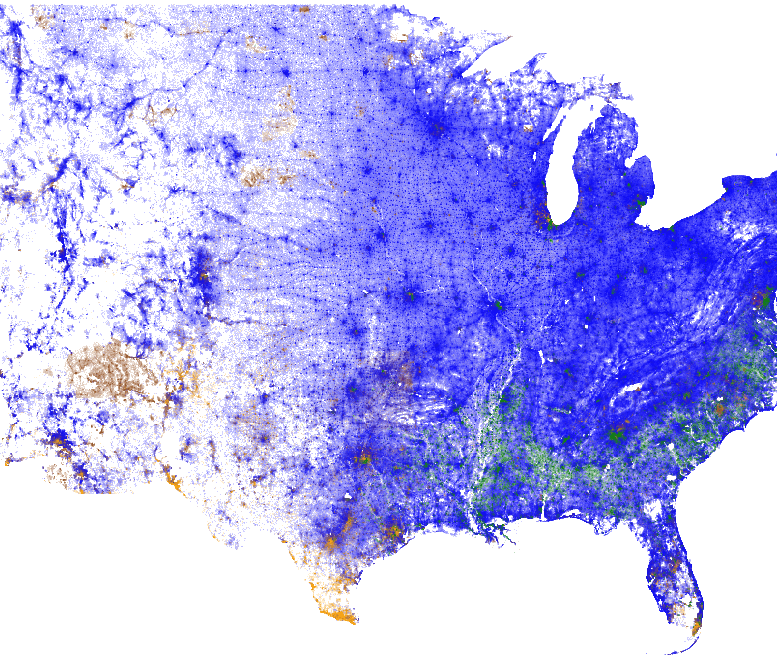
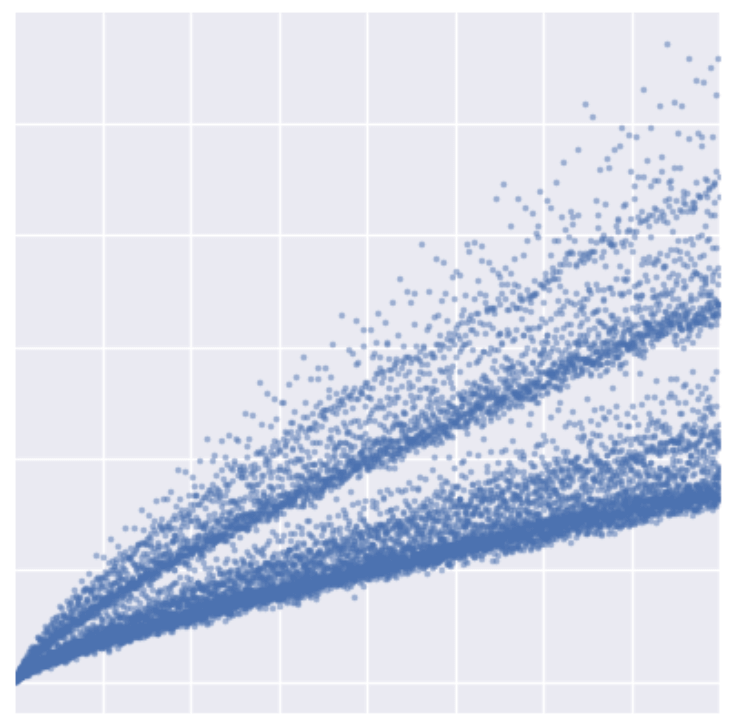
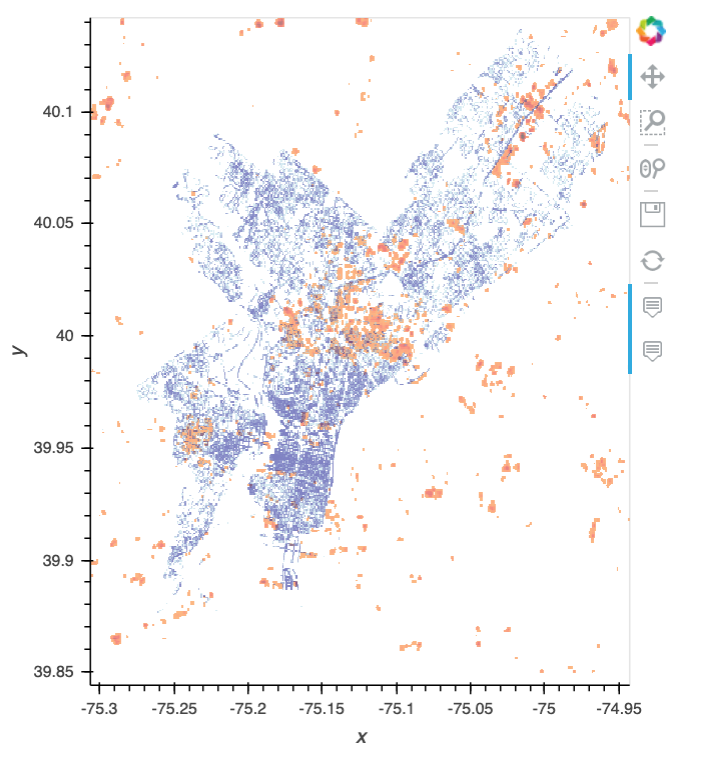
Interactive dashboard for making Datashader plots from any dataset that has latitude and longitude
Panel dashboard illustrating Euler’s Method
Map of confirmed and candidate exoplanets by discovery date
Using four different plotting libraries for the Hans Rosling gapminder example
Interactive dashboard for Genetic Algorithm
Combine data of very different types to show gerrymandering
Glaciers explorer using Datashader and Panel
Evaluating Goldbach function with Numba and plotting it with Datashader
Visualizing GPS tracking for herring gulls in Belgium
Analysis of how trees affect heat distribution in urban areas. Based on a blog post by Ken Steif.
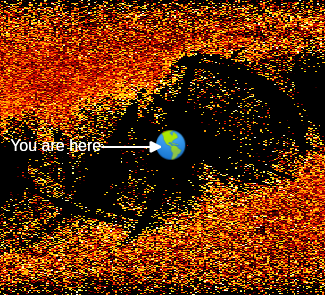
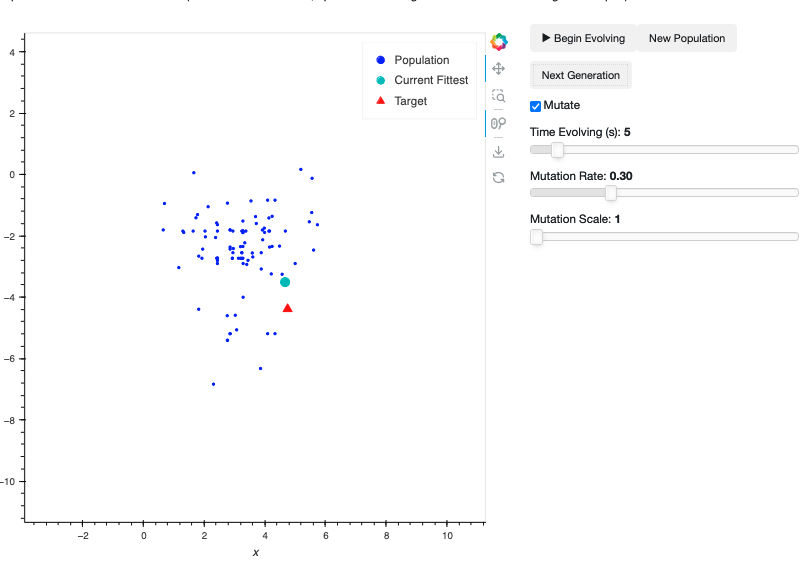
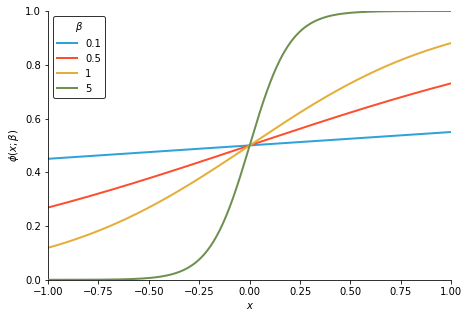
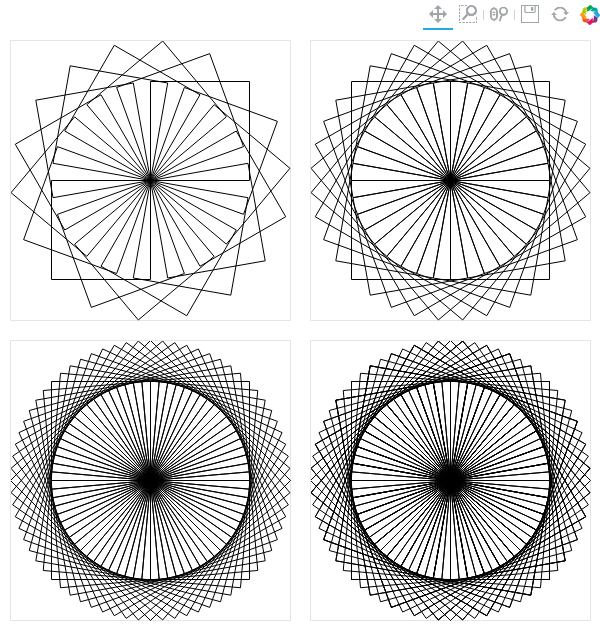
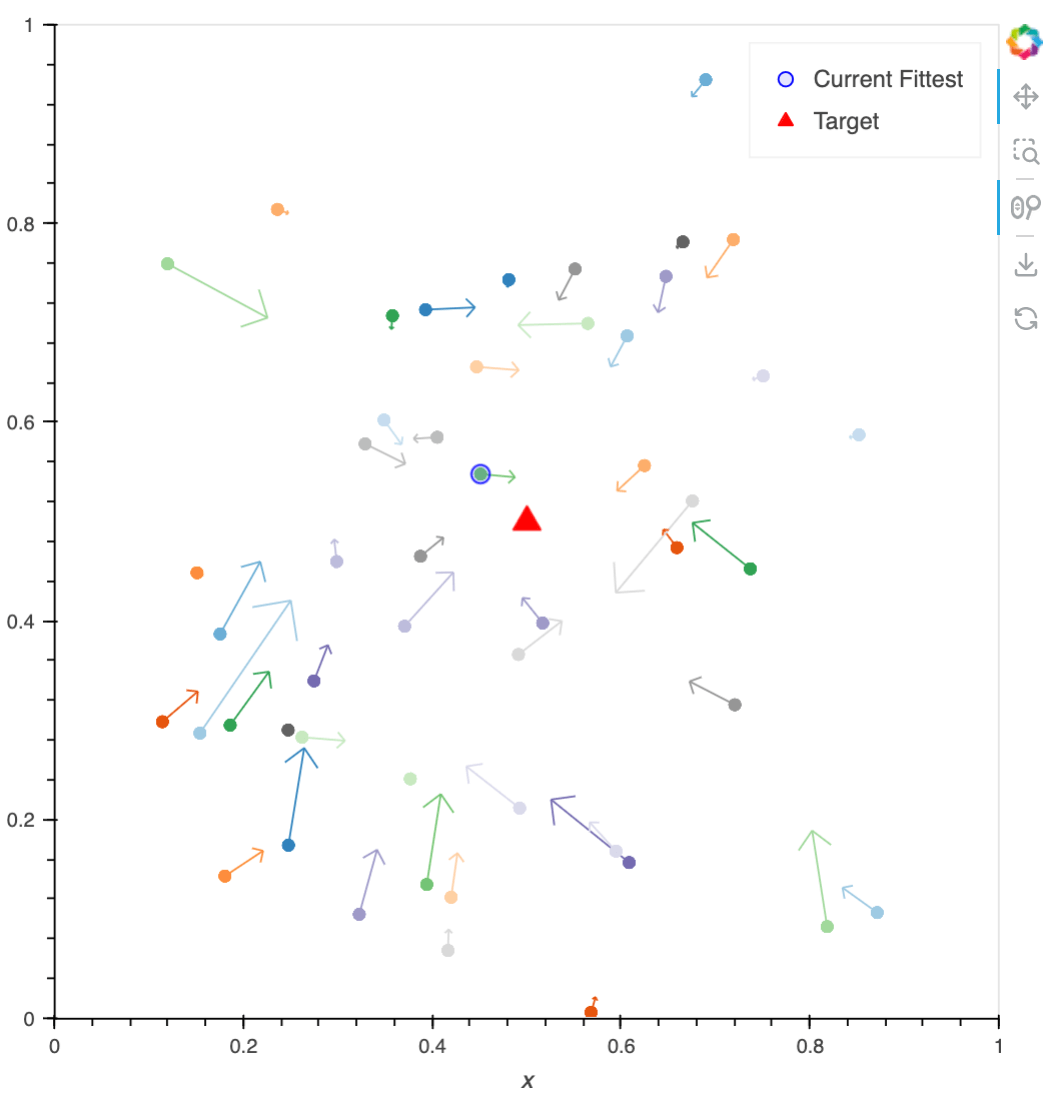
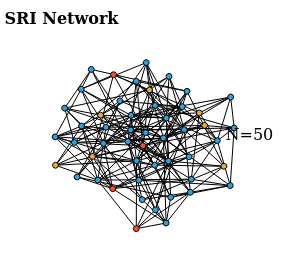
The Hipster Effect - An IPython Interactive Exploration. Adapted from the original notebook to use HoloViews by Philipp Rudiger.
Dashboard visualizing stock trades on the IEX exchange
Datashading LandSat8 raster satellite imagery
Example of spectral clustering landsat data
Image classification using the UC Merced Land Use Dataset
Lindenmayer system - a mathematical system used to describe growth processes
Using Bokeh/HoloViews/GeoViews for annotating data for ML
Graphing network packets using networkx, holoviews, and datashader
Visualize on a map all the buildings of New York City
Plotting the NYC taxi dataset using Datashader.
Datashading OpenSky flight trajectories
Datashading Open Street Map database
Interactive dashboard for Particle Swarm Optimisation
Palmer Penguin Cross-Filtering
Portfolio Optimizer Application
Visualize Lidar Scattered Point Elevation Data in Seattle
Visualizing AIS location tracking data for marine vessels near the USA
Recreating the Square Limit woodcut by M.C. Escher using Holoviews Spline
Agent based modelling in epidemiology using HoloViews
UK research networks with HoloViews, Bokeh, and Datashader
Analysis of NDVI over time of Walker Lake, Nevada